The Virus anybody else done the maths

Billysboots

Falling apart at the seams
Moderator
Joined
Aug 25, 2009
Messages
6,051
Visit site
The capacity and knowledge of the health service here is no doubt better than on lockdown day but it still feels a little uncomfortable to be unlocking.

I can’t recall the figures, but a high proportion of UK residents want lockdown to remain, which on the face of it is a surprise.

But I don’t doubt the main driver behind that is fear. Fear of catching the virus, and fear of the unknown. Life after lockdown for most is going to feel every bit as uncomfortable as life in it.
 

Swinglowandslow

Well-known member
Joined
Nov 19, 2018
Messages
2,724
Visit site
I can’t recall the figures, but a high proportion of UK residents want lockdown to remain, which on the face of it is a surprise.

But I don’t doubt the main driver behind that is fear. Fear of catching the virus, and fear of the unknown. Life after lockdown for most is going to feel every bit as uncomfortable as life in it.

Agreed. There are a lot of us oldies in this country. Interestingly, I read today that Chelsea and Westminster hospitals are doing trials with already-licensed drugs, several in fact, from which they have had encouraging results.
They are reasonably confident that this is the path to the easing (or even removal) of lockdown. The rationale is that the medicines will prevent the worst aspects of the virus to stop it being a death threat. There is talk of lockdown free by mid summer using this route.?
A vaccine is still some way off.
I hope this report has some merit. Another benefit of such a management of the virus would be that herd immunity would occur alongside.

Fingers crossed.
 

Hobbit

Mordorator
Moderator
Joined
Sep 11, 2011
Messages
18,865
Location
Espana
Visit site
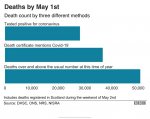
Saw an interesting way at looking at the mortality numbers earlier. Obviously there is the was it Covid, or was it an underlying condition debate that has been running. A number of people look at it different ways.

The article had a different take on it. It, perhaps, doesn't give a definitive number but it gives food for thought.

Picking easy number to explain it, lets say there are around 1000 deaths a day. There be some that are nailed on, unarguably Covid. Lets say 500. But if the average number of deaths for the day over the last 5 years is 400, that leaves 100 'new' deaths. Heart attack, triggered by Covid? A stroke triggered by Covid?

So is it 500 Covid deaths or is it 600?
 

ColchesterFC

Journeyman Pro
Joined
Jan 28, 2013
Messages
7,075
Visit site
Saw an interesting way at looking at the mortality numbers earlier. Obviously there is the was it Covid, or was it an underlying condition debate that has been running. A number of people look at it different ways.

The article had a different take on it. It, perhaps, doesn't give a definitive number but it gives food for thought.

Picking easy number to explain it, lets say there are around 1000 deaths a day. There be some that are nailed on, unarguably Covid. Lets say 500. But if the average number of deaths for the day over the last 5 years is 400, that leaves 100 'new' deaths. Heart attack, triggered by Covid? A stroke triggered by Covid?

So is it 500 Covid deaths or is it 600?

I believe that "excess" deaths are going to become the measure by which countries are ranked on their response to this situation. As an example, between 2010 and 2019 the UK saw X number of deaths on average. In 2020 the UK saw X + Y number of deaths. In Germany between 2010 and 2019 they saw X number of deaths on average. In 2020 they saw X + Y number of deaths. It will be the difference between the "normal" death rate and the current death rate that will educate us most on which countries responded best to the situation.
 

SocketRocket

Ryder Cup Winner
Joined
Sep 12, 2011
Messages
18,116
Visit site
I believe that "excess" deaths are going to become the measure by which countries are ranked on their response to this situation. As an example, between 2010 and 2019 the UK saw X number of deaths on average. In 2020 the UK saw X + Y number of deaths. In Germany between 2010 and 2019 they saw X number of deaths on average. In 2020 they saw X + Y number of deaths. It will be the difference between the "normal" death rate and the current death rate that will educate us most on which countries responded best to the situation.
Only if you consider them by population and population density.Even then I'm not sure if it's a proper comparison as this virus is so different to previous ones.
 

Slab

Occasional Tour Caddy
Joined
Nov 20, 2011
Messages
10,931
Location
Port Louis
Visit site
On the day Spain went into lockdown there were just over 9,000 active cases. Today, as Spain start to go through the phases of de-escalation there are just over 75,000 active cases.

On the day of lockdown there was a bit of a dip in deaths, 48, but had been 193 and 191 either side of lockdown day. Yesterday there were 281.

The capacity and knowledge of the health service here is no doubt better than on lockdown day but it still feels a little uncomfortable to be unlocking.

Prompted me to go back and check our numbers:

The night lockdown was announced we had 7 active cases found in preceding two days and no deaths, all businesses told to shut & all borders closed
Two days later and confinement level increased to 'curfew' after 1st death and people breaking confinement rules, all food stores told to shut for a week with immediate effect
Active cases increased to a total of 332
Six and a half weeks on and we now have just 3 active cases as of last night and there have been 10 deaths
Despite the numbers suggesting we should be 'unlocked' the Curfew period has actually been extended for another 4 weeks to 1st June. Schools are closed for another three months

I believe we are targeting a total eradication before letting people back outside and then they'll look at opening borders sometime after that
 

Imurg

The Grinder Of Pars (Semi Crocked)
Joined
Mar 15, 2008
Messages
36,892
Location
Aylesbury Bucks
Visit site
On the subject of numbers...
Keep an eye on Russia.
Their case numbers are sky rocketing
Relatively low mortality rate at the moment but.......
 

larmen

Head Pro
Joined
Nov 2, 2015
Messages
2,546
Visit site
I think the Russia numbers have been creative from the very beginning and I wouldn’t use them to see any kind of trend.
 

GB72

Money List Winner
Joined
May 8, 2007
Messages
14,514
Location
Rutland
Visit site
Just looking at a graph on the BBC live update showing the rolling number of deaths so a better graph to work from and it has got me asking, did we, in fact, flatten the curve much at all. The graphs I saw for a flattened curve should show a lower number of deaths on a daily basis but over a more prolonged period. The graph i am looking at seems to show the complete opposite, a steep climb to a peak around 10th April and then a drop off at a similar rate to the climb. Just does not look like I had understood that it would
 

SocketRocket

Ryder Cup Winner
Joined
Sep 12, 2011
Messages
18,116
Visit site
Just looking at a graph on the BBC live update showing the rolling number of deaths so a better graph to work from and it has got me asking, did we, in fact, flatten the curve much at all. The graphs I saw for a flattened curve should show a lower number of deaths on a daily basis but over a more prolonged period. The graph i am looking at seems to show the complete opposite, a steep climb to a peak around 10th April and then a drop off at a similar rate to the climb. Just does not look like I had understood that it would
Surely the curves to follow in this respect are the number of infections and numbers of critical care patients. The concern was that the numbers in critical care would pass the level of capacity for the NHS to cope. The death rate is (although very sad) a related outcome of the numbers in critical care.
 

pendodave

Tour Rookie
Joined
May 3, 2011
Messages
3,167
Visit site
Just looking at a graph on the BBC live update showing the rolling number of deaths so a better graph to work from and it has got me asking, did we, in fact, flatten the curve much at all. The graphs I saw for a flattened curve should show a lower number of deaths on a daily basis but over a more prolonged period. The graph i am looking at seems to show the complete opposite, a steep climb to a peak around 10th April and then a drop off at a similar rate to the climb. Just does not look like I had understood that it would
Optimistically, it has proved easier to control the number of new infections than they thought. Hence they've declined faster than expected....
 

ColchesterFC

Journeyman Pro
Joined
Jan 28, 2013
Messages
7,075
Visit site
Just looking at a graph on the BBC live update showing the rolling number of deaths so a better graph to work from and it has got me asking, did we, in fact, flatten the curve much at all. The graphs I saw for a flattened curve should show a lower number of deaths on a daily basis but over a more prolonged period. The graph i am looking at seems to show the complete opposite, a steep climb to a peak around 10th April and then a drop off at a similar rate to the climb. Just does not look like I had understood that it would

Another way to look at it could be that lockdown has worked better than expected. Instead of a long flattened peak it's coming down more steeply.
 

pendodave

Tour Rookie
Joined
May 3, 2011
Messages
3,167
Visit site
Also optimistically, I read that Austria has shown no significant increase n infection since restrictions were eased. This seems to be a pattern (Denmark, Czech Republic and Germany also seen to be under control) which might encourage our lot to look out from behind the sofa. Obviously big differences in demographics, population etc etc, but good news nonetheless.
 

BubbaP

Occasional Player of Golf
Joined
Oct 26, 2011
Messages
5,468
Location
Oxfordshire
Visit site
Putting aside the excitement of golf returning for some of us - this is a sobering graph ?

aviary-image-1589313560323.jpeg

I wonder if they'll be any whistleblowers from Russia also, can only assume their numbers are made up.
 
D

Deleted member 21258

Guest
https://twitter.com/cricketwyvern

If you like graphs/spreadsheets of figures, well worth looking at some of his graphs. Came across this guy a while ago and some of the tracking by date of death rather than when reported and breakdown are interesting.
 

drdel

Tour Rookie
Joined
Aug 28, 2013
Messages
4,374
Visit site
A big question is as the death rate gradient declines the 'curves' the daily deaths will fall and it will become asymptotic and stabilises at, we hope, the normal death rate. However it may never get to 'normal' and with the virus within the community how long do we wait and at what level above normal is acceptable?
 

Hobbit

Mordorator
Moderator
Joined
Sep 11, 2011
Messages
18,865
Location
Espana
Visit site
A big question is as the death rate gradient declines the 'curves' the daily deaths will fall and it will become asymptotic and stabilises at, we hope, the normal death rate. However it may never get to 'normal' and with the virus within the community how long do we wait and at what level above normal is acceptable?

We won’t know what the new normal death rate is whilst the social interaction is severely curbed.

Equally, there are a number of diseases around that have been here for hundreds of years. I do wonder if we will just have to learn to live with a new ‘Smallpox’ that might flare up.
 
Top