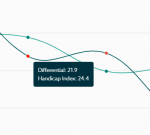
Trying to understand the WHCP graph

albie999

Newbie
Joined
Sep 26, 2017
Messages
241
Location
Newport, Wales
Visit site
I have started to register my rounds with the app for the World Handicap Golf System, that I need to use (Wales Golf App), however, I am slightly confused by the graph that they are presenting.

I kinda get what the green line is, however, do not understand the other line and how they relate to each other. I have looked on the help section of the app, but the description just seems to totally confuse me

Any help understanding this is appreciated

1660219293238.png
 

SwingsitlikeHogan

Major Champion
Joined
Jul 24, 2012
Messages
32,385
Visit site
I don’t think it’s possible to fully correlate the two lines. The two lines simply show the history of your scoring and HI. So for instance a counting score will generally impact your HI by reducing it, unless the counting score being replaced was your 20th, in which case your HI could go up rather than down.

I am guessing that the slight/minor up and down variations between scores (points on the curves) that seem inexplicable will be down to the mathematical order of polynomial (curve) used to fit a curve through the points defined by your scores…the variations are not real variations in your HI - they are a function of the mathematical curve fitting…well that’s my guess.
 

Neilds

Assistant Pro
Joined
Feb 25, 2014
Messages
3,694
Location
Wiltshire
Visit site
The 2nd line (with yellow and orange dots) is your score. Not exactly sure what the scale is on the vertical axis, may be score over par or score differential but either way the lower the dot, the better on that line.

Hopefully this is easier to understand that SILH's maths lesson :ROFLMAO:
 

albie999

Newbie
Joined
Sep 26, 2017
Messages
241
Location
Newport, Wales
Visit site
Thanks both, it looks like the score, is the score differential, which again might need a lesson on that ... I presume is the difference between my score .. say, I went round in 90, and what the course rating is .. say 72 PAR, the score differential would be 22 .... Or have I got that completely wrong?

1660224615427.png
 

rulefan

Tour Winner
Joined
Feb 21, 2013
Messages
14,608
Visit site
PAR is not necessarily the Course Rating.
But the Score Differential is
(Gross Score (adjusted for any net double bogeys) - Course Rating) x (113/Slope Rating).
 

albie999

Newbie
Joined
Sep 26, 2017
Messages
241
Location
Newport, Wales
Visit site
Score differential indicates the Handicap Index that has been 'played to' for a round on a specific course on a specific day
Ok, so in my case for the screenshot I provided .. I was playing off a HCP index of 24.4 (for that round) .. but I played to a HCP level of 21.9 (therefore under HCP)?
 

rulefan

Tour Winner
Joined
Feb 21, 2013
Messages
14,608
Visit site
What was your Gross Score, Index, Course Rating and Slope of the course on that day? Did you have any scores over net double bogey?
 

SwingsitlikeHogan

Major Champion
Joined
Jul 24, 2012
Messages
32,385
Visit site
…and if I am right the clever maths simply makes the lines look a bit sexier than simple straight lines joining the points defining HI and Round Differential, and, as a result, in between the points of each curve the curves are inaccurate of not meaningless.
 

Alan Clifford

Well-known member
Joined
Aug 13, 2020
Messages
919
Location
51.24545572099906, -0.5221967037089511
Visit site
…and if I am right the clever maths simply makes the lines look a bit sexier than simple straight lines joining the points defining HI and Round Differential, and, as a result, in between the points of each curve the curves are inaccurate of not meaningless.

Only the points are meaningful as the data is not continuous, and does not even exist, between the points.

The yellow dots are the 8 out of the last twenty differentials that are included in your current handicap index.
 

SwingsitlikeHogan

Major Champion
Joined
Jul 24, 2012
Messages
32,385
Visit site
Only the points are meaningful as the data is not continuous, and does not even exist, between the points.

The yellow dots are the 8 out of the last twenty differentials that are included in your current handicap index.
Yes indeed. But a set of discrete points does not an interesting graph make…and straight lines look a bit clunky, so let’s make a sexy curve ? That said - once we have 20 plus rounds any curve will tend towards being a pretty good fit - indeed straight lines between points will tend to such a curve. Doesn‘t make anything on any curve between points any more meaningful though.
 

Alan Clifford

Well-known member
Joined
Aug 13, 2020
Messages
919
Location
51.24545572099906, -0.5221967037089511
Visit site
Yes indeed. But a set of discrete points does not an interesting graph make…and straight lines look a bit clunky, so let’s make a sexy curve ? That said - once we have 20 plus rounds any curve will tend towards being a pretty good fit - indeed straight lines between points will tend to such a curve. Doesn‘t make anything on any curve between points any more meaningful though.

I use straight lines.


Iusestraightlines.jpg
 

jim8flog

Journeyman Pro
Joined
May 20, 2017
Messages
14,864
Location
Yeovil
Visit site
I have started to register my rounds with the app for the World Handicap Golf System, that I need to use (Wales Golf App), however, I am slightly confused by the graph that they are presenting.

I kinda get what the green line is, however, do not understand the other line and how they relate to each other. I have looked on the help section of the app, but the description just seems to totally confuse me

Any help understanding this is appreciated

View attachment 43813


At the moment you only have 6 scores on your record so your Handiicap Index is the average of the best 2 minus one shot

The line with red and yellow dots are your actual differentials. The red dots (non counting) are scores not used in the calculation and the yellows ones (counting) are the 2 used in the calculation. as you add scores red dots may change to yellow ones as more and more scores are used in the calculation.

Ongoing

1620552240016.jpg
 
Top