• Thanks to each and every one of you for being part of the Golf Monthly community! We hope you have a joyous holiday season!

WHS doesn't work

D-S

Well-known member
Joined
Dec 31, 2020
Messages
4,174
Location
Bristol
Visit site
Is this meant to be joke response?

If yes ignore my next comment. The difficulty of the course has always been factored in to your handicap previously it was SSS/CSS and not par as many believe. It is just that it takes and extra calculation these days and your score will be compared against the Course rating for you handicap record.
It is merely suggesting that if we used CR-Par in the calculation of Course Handicap (as the rest of the world outside CONGU do) then the difficulty of the course would be factored in to your course Handicap - we would therefore already know the performance against CR which has sparked this debate.

Then we wouldn't have people permanently talking about points vs. Par, then having to have questions posed about course difficulty and needing to know CR etc, etc.
 

Alan Clifford

Well-known member
Joined
Aug 13, 2020
Messages
1,154
Location
51.24545572099906, -0.5221967037089511
Visit site
It is merely suggesting that if we used CR-Par in the calculation of Course Handicap (as the rest of the world outside CONGU do) then the difficulty of the course would be factored in to your course Handicap - we would therefore already know the performance against CR which has sparked this debate.

Then we wouldn't have people permanently talking about points vs. Par, then having to have questions posed about course difficulty and needing to know CR etc, etc.

I don't understand why congu do it. It means another calculation for mixed tee competitions as well as not relating to the actual differential calculations.
 
  • Like
Reactions: D-S

nickjdavis

Head Pro
Joined
Jul 31, 2015
Messages
4,210
Visit site
Some stats and graphs...

Now we have had two full calendar years of the WHS in operation I thought I would look at some of the scoring patterns across 2021/22 and see of anything was amiss....regular ridiculous scores winning comps, outlandish handicaps winning comps, whether the handicap system favours low or high handicappers yada yada yada....make of the following what you will...

So....I looked at 51 comps over the last two years (32 s'ford and 19 medals)...seniors only comps excluded. 3077 submitted scores....a tad over 60 entries/comp. Best stableford score seen in that time was 47 points, best medal score was nett 59 (twice)...par 70 course, CR 68.7 Slope 124.

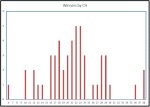
Firstly the distribution of scores submitted by Course Handicap...

Capture1.JPG

Next... average stableford points and nett medal score by course handicap...
Capture2.JPG
Capture3.JPG

So...pretty much as expected...a slight bias towards the consistency of the lower handicap golfer and some volatility in medal scores for higher handicappers

Now for two graphs showing the scoring distribution...

Capture4.JPG
Capture5.JPG

So stableford scores averaging around 31-32pts, medal scores around 74

Finally for the ones that I find most interesting. If you take the finishing position of every player in each comp and normalised them so as to make each comp the same number of entries...what would be the average finishing position of each handicap? In a perfectly balanced system, equally fair system that fully took account of ability and consistency you would expect all handicaps to, on average, over a number of competitions to finish at the halfway point in the field....everyone has an even chance of finishing anywhere. In this case I chose a normalise field of 60...so would expect that each handicap level, would on average, finish in 30th place...assuming all was fair with the world. Two graphs are shown...one for each discrete course handicap, the other for 7 ranges of course handicaps...rather than split the ranges into even number of handicaps I chose the ranges so that each group would have submitted roughly 1/7th of all the entries over the two years...this helps remove some of the volatility seen in the higher handicap rnages where fewer scores are submitted...

Capture6.JPG
Capture7.JPG

I think that these show that the WHS makes a pretty good fist of balancing things out....yes there is still a bias towards the lower handicapper who on average, finishes higher up the leaderboard...maybe getting rid of the 95% allowance might even things out further?

Just thought I would share these...the only conclusion I would draw is that at my club, the WHS works pretty well, we have no regular outlandish scores, nor are we overrun by vast hordes of 40+ handicappers winning everything, and things appear to be reasonably fairly balanced.
 

Bdill93

Undisputed King of FOMO
Joined
Jun 18, 2020
Messages
5,749
Visit site
Some stats and graphs...

Now we have had two full calendar years of the WHS in operation I thought I would look at some of the scoring patterns across 2021/22 and see of anything was amiss....regular ridiculous scores winning comps, outlandish handicaps winning comps, whether the handicap system favours low or high handicappers yada yada yada....make of the following what you will...

So....I looked at 51 comps over the last two years (32 s'ford and 19 medals)...seniors only comps excluded. 3077 submitted scores....a tad over 60 entries/comp. Best stableford score seen in that time was 47 points, best medal score was nett 59 (twice)...par 70 course, CR 68.7 Slope 124.

Firstly the distribution of scores submitted by Course Handicap...

View attachment 46823

Next... average stableford points and nett medal score by course handicap...
View attachment 46824
View attachment 46825

So...pretty much as expected...a slight bias towards the consistency of the lower handicap golfer and some volatility in medal scores for higher handicappers

Now for two graphs showing the scoring distribution...

View attachment 46826
View attachment 46827

So stableford scores averaging around 31-32pts, medal scores around 74

Finally for the ones that I find most interesting. If you take the finishing position of every player in each comp and normalised them so as to make each comp the same number of entries...what would be the average finishing position of each handicap? In a perfectly balanced system, equally fair system that fully took account of ability and consistency you would expect all handicaps to, on average, over a number of competitions to finish at the halfway point in the field....everyone has an even chance of finishing anywhere. In this case I chose a normalise field of 60...so would expect that each handicap level, would on average, finish in 30th place...assuming all was fair with the world. Two graphs are shown...one for each discrete course handicap, the other for 7 ranges of course handicaps...rather than split the ranges into even number of handicaps I chose the ranges so that each group would have submitted roughly 1/7th of all the entries over the two years...this helps remove some of the volatility seen in the higher handicap rnages where fewer scores are submitted...

View attachment 46828
View attachment 46829

I think that these show that the WHS makes a pretty good fist of balancing things out....yes there is still a bias towards the lower handicapper who on average, finishes higher up the leaderboard...maybe getting rid of the 95% allowance might even things out further?

Just thought I would share these...the only conclusion I would draw is that at my club, the WHS works pretty well, we have no regular outlandish scores, nor are we overrun by vast hordes of 40+ handicappers winning everything, and things appear to be reasonably fairly balanced.

Ill be the first to say - great data!

Would love to see this done with the scores at my club. :ROFLMAO:
 

Swango1980

Well-known member
Joined
Jul 22, 2019
Messages
13,146
Location
Lincolnshire
Visit site
Some stats and graphs...

Now we have had two full calendar years of the WHS in operation I thought I would look at some of the scoring patterns across 2021/22 and see of anything was amiss....regular ridiculous scores winning comps, outlandish handicaps winning comps, whether the handicap system favours low or high handicappers yada yada yada....make of the following what you will...

So....I looked at 51 comps over the last two years (32 s'ford and 19 medals)...seniors only comps excluded. 3077 submitted scores....a tad over 60 entries/comp. Best stableford score seen in that time was 47 points, best medal score was nett 59 (twice)...par 70 course, CR 68.7 Slope 124.

Firstly the distribution of scores submitted by Course Handicap...

View attachment 46823

Next... average stableford points and nett medal score by course handicap...
View attachment 46824
View attachment 46825

So...pretty much as expected...a slight bias towards the consistency of the lower handicap golfer and some volatility in medal scores for higher handicappers

Now for two graphs showing the scoring distribution...

View attachment 46826
View attachment 46827

So stableford scores averaging around 31-32pts, medal scores around 74

Finally for the ones that I find most interesting. If you take the finishing position of every player in each comp and normalised them so as to make each comp the same number of entries...what would be the average finishing position of each handicap? In a perfectly balanced system, equally fair system that fully took account of ability and consistency you would expect all handicaps to, on average, over a number of competitions to finish at the halfway point in the field....everyone has an even chance of finishing anywhere. In this case I chose a normalise field of 60...so would expect that each handicap level, would on average, finish in 30th place...assuming all was fair with the world. Two graphs are shown...one for each discrete course handicap, the other for 7 ranges of course handicaps...rather than split the ranges into even number of handicaps I chose the ranges so that each group would have submitted roughly 1/7th of all the entries over the two years...this helps remove some of the volatility seen in the higher handicap rnages where fewer scores are submitted...

View attachment 46828
View attachment 46829

I think that these show that the WHS makes a pretty good fist of balancing things out....yes there is still a bias towards the lower handicapper who on average, finishes higher up the leaderboard...maybe getting rid of the 95% allowance might even things out further?

Just thought I would share these...the only conclusion I would draw is that at my club, the WHS works pretty well, we have no regular outlandish scores, nor are we overrun by vast hordes of 40+ handicappers winning everything, and things appear to be reasonably fairly balanced.
Good work. Do you have a graph that plots the winners of a competition against handicap. Would be interesting to see how that compares with your 1st graph

P.S. I suppose you'd need to choose the best overall score, if your club uses multiple divisions in certain comps
 

RichA

Well-known member
Joined
Jan 24, 2021
Messages
4,101
Location
UK
Visit site
I'd also like to see a graph that shows winning scores compared to the prizes at stake.
The prizes for the minor comps at ours are a sleeve of 3 mid-priced balls. The major comps get 3 balls and a cheap engraved beer mug.
We very rarely get a winning score around 40.
I suspect that the perceived flaws in WHS are more to do with greedy individuals manipulating the system rather than the system itself.
 

D-S

Well-known member
Joined
Dec 31, 2020
Messages
4,174
Location
Bristol
Visit site
I'd also like to see a graph that shows winning scores compared to the prizes at stake.
The prizes for the minor comps at ours are a sleeve of 3 mid-priced balls. The major comps get 3 balls and a cheap engraved beer mug.
We very rarely get a winning score around 40.
I suspect that the perceived flaws in WHS are more to do with greedy individuals manipulating the system rather than the system itself.
Agreed, but the ease of manipulation also contributes to this.
 

nickjdavis

Head Pro
Joined
Jul 31, 2015
Messages
4,210
Visit site
I'd also like to see a graph that shows winning scores compared to the prizes at stake.
The prizes for the minor comps at ours are a sleeve of 3 mid-priced balls. The major comps get 3 balls and a cheap engraved beer mug.
We very rarely get a winning score around 40.
I suspect that the perceived flaws in WHS are more to do with greedy individuals manipulating the system rather than the system itself.

Not relevant at our club. Prize fund is directly in proportion to the number of entrants.

In medals we have 3 divisions and first/second/third in each division get exactly the same prize. In Stablefords we increase the prize "money" paid out to a certain extent but after a while, instead of increasing the payouts for 1st/2nd/3rd etc. we start paying out for 6th/7th/8th places. Its more a case of spreading the prizes around rather than giving out lottery style headline amounts. We generally pay out roughly 85% of entry fees in prizes.
 

nickjdavis

Head Pro
Joined
Jul 31, 2015
Messages
4,210
Visit site
Good work. Do you have a graph that plots the winners of a competition against handicap. Would be interesting to see how that compares with your 1st graph

P.S. I suppose you'd need to choose the best overall score, if your club uses multiple divisions in certain comps

I do. It doesn't compare at all. Our mid (10-15) handicappers are vastly under performing (in terms of winning) compared to their representation...

Capture8.JPG

However....if you start to expand things a bit and look at top 5 / top 10 placings then this happens...

Capture9.JPG

all of a sudden the lower handicaps start filling up the places more in line with the proportion of entries - except our 13-15 guys who do appear to be criminally poor!!!...might have to delve deeper in to their scoring patterns later to see why they are so bad!!!
 
Last edited:

rosecott

Money List Winner
Joined
May 12, 2011
Messages
7,779
Location
Notts
Visit site
Not sure returns are compulsory for non-qualifying?

Hadn't noticed a mention of non-Q.

The only reasons I can think of for N/R in a stableford comp are:

Failure to submit a scorecard, or

Failure to complete 10 holes in an 18-hole comp.
 

Backsticks

Assistant Pro
Banned
Joined
Aug 7, 2012
Messages
3,852
Visit site
Some stats and graphs...

Now we have had two full calendar years of the WHS in operation I thought I would look at some of the scoring patterns across 2021/22 and see of anything was amiss....regular ridiculous scores winning comps, outlandish handicaps winning comps, whether the handicap system favours low or high handicappers yada yada yada....make of the following what you will...

So....I looked at 51 comps over the last two years (32 s'ford and 19 medals)...seniors only comps excluded. 3077 submitted scores....a tad over 60 entries/comp. Best stableford score seen in that time was 47 points, best medal score was nett 59 (twice)...par 70 course, CR 68.7 Slope 124.

Firstly the distribution of scores submitted by Course Handicap...

View attachment 46823

Next... average stableford points and nett medal score by course handicap...
View attachment 46824
View attachment 46825

So...pretty much as expected...a slight bias towards the consistency of the lower handicap golfer and some volatility in medal scores for higher handicappers

Now for two graphs showing the scoring distribution...

View attachment 46826
View attachment 46827

So stableford scores averaging around 31-32pts, medal scores around 74

Finally for the ones that I find most interesting. If you take the finishing position of every player in each comp and normalised them so as to make each comp the same number of entries...what would be the average finishing position of each handicap? In a perfectly balanced system, equally fair system that fully took account of ability and consistency you would expect all handicaps to, on average, over a number of competitions to finish at the halfway point in the field....everyone has an even chance of finishing anywhere. In this case I chose a normalise field of 60...so would expect that each handicap level, would on average, finish in 30th place...assuming all was fair with the world. Two graphs are shown...one for each discrete course handicap, the other for 7 ranges of course handicaps...rather than split the ranges into even number of handicaps I chose the ranges so that each group would have submitted roughly 1/7th of all the entries over the two years...this helps remove some of the volatility seen in the higher handicap rnages where fewer scores are submitted...

View attachment 46828
View attachment 46829

I think that these show that the WHS makes a pretty good fist of balancing things out....yes there is still a bias towards the lower handicapper who on average, finishes higher up the leaderboard...maybe getting rid of the 95% allowance might even things out further?

Just thought I would share these...the only conclusion I would draw is that at my club, the WHS works pretty well, we have no regular outlandish scores, nor are we overrun by vast hordes of 40+ handicappers winning everything, and things appear to be reasonably fairly balanced.

Great stats and analysis. WHS certainly working very well, probably better than UHS. Lower handicappers still have a slight advantage but its low enough not to worry about. I wonder would a single ratio of 0.96 or 0.97 level it a little better ?
 

Swango1980

Well-known member
Joined
Jul 22, 2019
Messages
13,146
Location
Lincolnshire
Visit site
I do. It doesn't compare at all. Our mid (10-15) handicappers are vastly under performing (in terms of winning) compared to their representation...

View attachment 46840

However....if you start to expand things a bit and look at top 5 / top 10 placings then this happens...

View attachment 46842

all of a sudden the lower handicaps start filling up the places more in line with the proportion of entries - except our 13-15 guys who do appear to be criminally poor!!!...might have to delve deeper in to their scoring patterns later to see why they are so bad!!!
So, in terms of winning an event, the lower handicaps can accept they have little chance, in relation to the proportion that enter. But, anyone over 16 the odds go right up, even more so over 22.

However, if the goal is to finish in top 3, the lower handicappers have a more equitable chance, and slight raised probability to finish top 5 and top 10. Excluding your 13-15 guys of course. No idea what is going on with them. They need to have a long, hard look at themselves :)
 

garyo

Medal Winner
Joined
Jul 26, 2016
Messages
32
Visit site
Hadn't noticed a mention of non-Q.

The only reasons I can think of for N/R in a stableford comp are:

Failure to submit a scorecard, or

Failure to complete 10 holes in an 18-hole comp.

Apologies, I thought that had been highlighted in an earlier post. It garnered a lot of attention in local social media also (as you can imagine!) so it’s been hard to keep up!

Non-Q, significantly shorter winter track, mats everywhere (apart from really heavy, unmaintained rough), unseasonal dry/firm ground conditions…a perfect storm really unfortunately.
 

clubchamp98

Journeyman Pro
Joined
Jan 23, 2014
Messages
18,491
Location
Liverpool
Visit site
So, in terms of winning an event, the lower handicaps can accept they have little chance, in relation to the proportion that enter. But, anyone over 16 the odds go right up, even more so over 22.

However, if the goal is to finish in top 3, the lower handicappers have a more equitable chance, and slight raised probability to finish top 5 and top 10. Excluding your 13-15 guys of course. No idea what is going on with them. They need to have a long, hard look at themselves :)
I have never met a low cap golfer whose goal is top three.
we all go out to win.
 

nickjdavis

Head Pro
Joined
Jul 31, 2015
Messages
4,210
Visit site
Great stats and analysis. WHS certainly working very well, probably better than UHS. Lower handicappers still have a slight advantage but its low enough not to worry about. I wonder would a single ratio of 0.96 or 0.97 level it a little better ?

Hang on....you cant say that...it is contrary to the entire rationale behind this thread. :LOL::LOL::LOL:
 

rulefan

Tour Winner
Joined
Feb 21, 2013
Messages
15,432
Visit site
Great stats and analysis. WHS certainly working very well, probably better than UHS. Lower handicappers still have a slight advantage but its low enough not to worry about. I wonder would a single ratio of 0.96 or 0.97 level it a little better ?
The only problem is the number of 'cheats' or dilatory committees a number of clubs reported here seem to have. But WHS didn't cause that - they have always been around.
 
Top