Coronavirus - how is it/has it affected you?

PNWokingham

Journeyman Pro
Joined
Jun 20, 2010
Messages
3,491
Location
Berks
Visit site
I am not missing the point at all, you cited Sweden as an example of things being done better, and I refuted it. People need to get off this false idea that Sweden had a good lockdown. They didn't. They had a disaster. Their situation is, in many ways, not comparable to us but if you think it is, so too are New Zealand or South Korea. They locked down hard and had much better case and death rates than either the UK or Sweden.

Now you are switching to an unsubstantiated point that the effects on deaths and the economy is worse than Covid, and are getting exponentially worse. Is that taking the piss, using the term used to describe pandemic growth? In any case, it simply isn't true. The economic effects would have been much less had effective and swift control been applied in a timely manner to Covid. That is the lesson of history seen in previous pandemics. Instead we have seen an utter [banned word] show, and failing to control things now will only prolong matters.

The lunatic plans for herd immunity advocated by the American libertarians funding the Great Barrington Declaration will not work, but will cost tens or hundreds of thousands of lives while failing. It is utterly irresponsible, if not criminal. It will also take a long time to play out, during which the NHS will be overwhelmed, unless there is also a plan for lime pits to push the bodies into instead. Plenty of cancer patients will die while the hospitals are packed full of the victims of herd immunity.

There is clearly an adverse effect of Covid on other aspects of the NHS, and I know plenty of people working their arses off to reduce it. I know for a fact that you can get face to face doctors appts if one is needed, my wife is one such doctor who offers them, and I know plenty of doctors in frontline specialties across the board who are likewise working hard to keep things going in difficult circumstances. I don't know, nor want to know, anything about your family's situation or whether face to face was really needed, but regardless I don't think you can extrapolate their experience to the whole country's NHS experience.

This pandemic is having effects on all of us, and in some cases they are very bad effects, but magical thinking ain't going to fix it.

and i will bite my tongue at your aggressive, judgemental, superior bullying attitude. And will not respond to you again. You have a shocking attitude. Go preach elsewhere.
 

PNWokingham

Journeyman Pro
Joined
Jun 20, 2010
Messages
3,491
Location
Berks
Visit site

SocketRocket

Ryder Cup Winner
Joined
Sep 12, 2011
Messages
18,129
Visit site
https://www.dailymail.co.uk/money/n...orrowing-bill-set-hit-half-TRILLION-year.html

Money does not grow on trees. We need to focus on protecting the small minority who are in real danger from covid and then keeping solvent as a country to help the other 99% who need to work, feed their families etc
What is this small minority, please quantify, it would probably be in the order of 20 Million people. You still haven't explained how you propose to protect them, if it means locking them up then it's unfair and undoable. If Covid continues to rip through society the damage will be worse than the cure you propose.
 
Last edited:

PNWokingham

Journeyman Pro
Joined
Jun 20, 2010
Messages
3,491
Location
Berks
Visit site
What is this small minority, please quantify it. You still haven't explained how you propose to protect them, if it means locking them up then it's unfair and undoable. If Covid continues to rip through society the damage will be worse than the cure you propose.

go read what DRW posted or my earlier posts. Can't repeat myself again. £200bn or so so far and growing - that is a lot of firepower to use to add to NHS are care homes, that would be available if we had let the mainstream econonmy carry on
 

ColchesterFC

Journeyman Pro
Joined
Jan 28, 2013
Messages
7,158
Visit site
What is this small minority, please quantify, it would probably be in the order of 20 Million people. You still haven't explained how you propose to protect them, if it means locking them up then it's unfair and undoable. If Covid continues to rip through society the damage will be worse than the cure you propose.

I agree. And how do you define who are the vulnerable?

Obviously those in care homes are in this category but how do you protect them? Do all care home staff have to live-in at the care home? If not, what about those with families? If they have kids at school they could bring the virus home and pass it on to mum or dad to take back to the care home.

What about vulnerable people that live at home but need a carer? How do you protect that person when the carer is seeing 10 or 12 different people each day?

What about someone with an underlying health condition? Do their kids have to stay off school to protect their vulnerable parent?

"Protecting the vulnerable" is a lovely little catchphrase but is unrealistic and unworkable.
 

Ethan

Money List Winner
Joined
Jun 30, 2009
Messages
11,793
Location
Bearwood Lakes, Berks
Visit site
well. Now i know. Pointless saying the same things again. Go have your view and i wil have mine.

I suspect you still don't know and your answer proves you don't want to know. Proponents of the herd immunity idea just know in their minds it is the right thing to do and care little for facts, any actual plan for how it might work (because it won't). Just like another recent idea, it is an act of faith not evidence.

Setting aside the mss laughter of older and middle aged people, the practical issue is that if you let the virus go, it will cause so many cases that the NHS is completely seized up for months, and no cancer patients or your relatives will get appointments of any sort. If you want to manage the flow of herd immunity sacrifices, then you need some sort of lockdown to throttle the demand.

It can't possibly work, and nobody who advocates it has even attempted to suggest a method by which it would.
 

Ethan

Money List Winner
Joined
Jun 30, 2009
Messages
11,793
Location
Bearwood Lakes, Berks
Visit site
and i will bite my tongue at your aggressive, judgemental, superior bullying attitude. And will not respond to you again. You have a shocking attitude. Go preach elsewhere.

Bite more than that. I am not the one who wants to kill tens of thousands or people. How your attitude to human life makes you think you think you are morally superior is a mystery. Typical libertarian attitude to avoid answering and have a tantrum instead, attack the person not the arguments. Your post is all about attacking me. Mine was all about attacking the arguments you made, not you personally. If you can't be mature about it, please don't respond any more. But I will refute your arguments where they are bad ones, and am willing to agree with them when they are good. Not holding my breath, though.
 
Last edited:

Ethan

Money List Winner
Joined
Jun 30, 2009
Messages
11,793
Location
Bearwood Lakes, Berks
Visit site
I agree. And how do you define who are the vulnerable?

Obviously those in care homes are in this category but how do you protect them? Do all care home staff have to live-in at the care home? If not, what about those with families? If they have kids at school they could bring the virus home and pass it on to mum or dad to take back to the care home.

What about vulnerable people that live at home but need a carer? How do you protect that person when the carer is seeing 10 or 12 different people each day?

What about someone with an underlying health condition? Do their kids have to stay off school to protect their vulnerable parent?

"Protecting the vulnerable" is a lovely little catchphrase but is unrealistic and unworkable.

The proponents of this approach don't really care, and have no plan. They have basically taken a position of open the economy and screwing the old and weak is a price worth paying. They have no thought for how this would actually play out.
 

Kellfire

Blackballed
Joined
Jul 11, 2009
Messages
7,580
Location
Leeds
Visit site
and i will bite my tongue at your aggressive, judgemental, superior bullying attitude. And will not respond to you again. You have a shocking attitude. Go preach elsewhere.
His response was measured and informative from a position of knowledge and aimed entirely at refuting inaccuracies in your own statements.

You’re simply offended at the fact someone is questioning you which is something you’ve repeatedly shown form for.
 

road2ruin

Q-School Graduate
Joined
Jan 3, 2012
Messages
2,332
Location
Surrey
Visit site
Yesterday I asked why SAGE weren't being more transparent with the data, I was told that it's all out there however it isn't. I am not talking about ONS data etc, it was more the assumptions etc that gave the basis of their figure of 4,000+ deaths per day. Before I am called out as a 'Covid -denier' or 'Covidiot' I am neither, I have no issues with tighter restrictions as long as they are required and that they are backed up with appropriate data. Anyway, it appears that I am not alone as Chris Whitty and Patrick Vallance have been called before the Science and Technology Select Committee this afternoon to explain the figures given on Saturday.

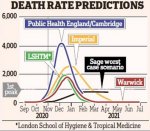
This is the graph that has caused the particular concern...

Death Rate Predictoins.jpg

SAGE's figures are 1,800 more than any other model, that's a huge (and for the general population, frightening) number and if correct then you cannot argue against the case for lockdown. In context, this number is 4 times higher than the worst day of death during the first wave. However, what they haven't been so forthcoming about is that this model was put together using data that was old, it was before the new Tier system was put in place. It has been acknowledged (ONS data) that in the north west the number of cases we levelling out and the R-rate nationally was starting to come down (albeit slowly). The above model was based on an R rate of 1.3-15 however the day before the announcement the Government's official R rate was 1.1-1.3. Again, why the usage of out of date data for something so important as a national lockdown? Yesterday the government office for science was asked which groups had modelled the varying scenarios, or what parameters had been used to creative the graph used at the weekend but refused. Why refuse if you're using data that clearly supports your argument?

I suspect I was be dismissed however to be clear, I am not against restrictions and I am not advocating herd immunity etc however what I am saying is that if there restrictions are to be put in place then surely there needs to be more transparency and the data/graphs that they're scaring the general public with need to be accurate?
 

SwingsitlikeHogan

Major Champion
Joined
Jul 24, 2012
Messages
32,578
Visit site
Yesterday I asked why SAGE weren't being more transparent with the data, I was told that it's all out there however it isn't. I am not talking about ONS data etc, it was more the assumptions etc that gave the basis of their figure of 4,000+ deaths per day. Before I am called out as a 'Covid -denier' or 'Covidiot' I am neither, I have no issues with tighter restrictions as long as they are required and that they are backed up with appropriate data. Anyway, it appears that I am not alone as Chris Whitty and Patrick Vallance have been called before the Science and Technology Select Committee this afternoon to explain the figures given on Saturday.

This is the graph that has caused the particular concern...

View attachment 33284

SAGE's figures are 1,800 more than any other model, that's a huge (and for the general population, frightening) number and if correct then you cannot argue against the case for lockdown. In context, this number is 4 times higher than the worst day of death during the first wave. However, what they haven't been so forthcoming about is that this model was put together using data that was old, it was before the new Tier system was put in place. It has been acknowledged (ONS data) that in the north west the number of cases we levelling out and the R-rate nationally was starting to come down (albeit slowly). The above model was based on an R rate of 1.3-15 however the day before the announcement the Government's official R rate was 1.1-1.3. Again, why the usage of out of date data for something so important as a national lockdown? Yesterday the government office for science was asked which groups had modelled the varying scenarios, or what parameters had been used to creative the graph used at the weekend but refused. Why refuse if you're using data that clearly supports your argument?

I suspect I was be dismissed however to be clear, I am not against restrictions and I am not advocating herd immunity etc however what I am saying is that if there restrictions are to be put in place then surely there needs to be more transparency and the data/graphs that they're scaring the general public with need to be accurate?

Do you mean PHE's figures?

Anyway - my guess is that one of the Whitty/Vallance Charts we were shown covered the spread of predictions shown in the chart you have posted in the form of a prediction (consensus view) plus uncertainty bounds. Draw a vertical line down mid-December and I am guessing that the PHE (the highest) will be reflected by the upper uncertainty bound shown on Whitty/Vallance chart - and the Sage Worst Case (the lowest) will be reflected by the lower uncertainty bound - with the 'consensus' shown by Whitty/Vallance somewhere in between. That's just my first glance quick take from it. I might have got it totally wrong.
 
Last edited:

Ethan

Money List Winner
Joined
Jun 30, 2009
Messages
11,793
Location
Bearwood Lakes, Berks
Visit site
Yesterday I asked why SAGE weren't being more transparent with the data, I was told that it's all out there however it isn't. I am not talking about ONS data etc, it was more the assumptions etc that gave the basis of their figure of 4,000+ deaths per day. Before I am called out as a 'Covid -denier' or 'Covidiot' I am neither, I have no issues with tighter restrictions as long as they are required and that they are backed up with appropriate data. Anyway, it appears that I am not alone as Chris Whitty and Patrick Vallance have been called before the Science and Technology Select Committee this afternoon to explain the figures given on Saturday.

This is the graph that has caused the particular concern...

View attachment 33284

SAGE's figures are 1,800 more than any other model, that's a huge (and for the general population, frightening) number and if correct then you cannot argue against the case for lockdown. In context, this number is 4 times higher than the worst day of death during the first wave. However, what they haven't been so forthcoming about is that this model was put together using data that was old, it was before the new Tier system was put in place. It has been acknowledged (ONS data) that in the north west the number of cases we levelling out and the R-rate nationally was starting to come down (albeit slowly). The above model was based on an R rate of 1.3-15 however the day before the announcement the Government's official R rate was 1.1-1.3. Again, why the usage of out of date data for something so important as a national lockdown? Yesterday the government office for science was asked which groups had modelled the varying scenarios, or what parameters had been used to creative the graph used at the weekend but refused. Why refuse if you're using data that clearly supports your argument?

I suspect I was be dismissed however to be clear, I am not against restrictions and I am not advocating herd immunity etc however what I am saying is that if there restrictions are to be put in place then surely there needs to be more transparency and the data/graphs that they're scaring the general public with need to be accurate?


In that graphic, the line marked as the SAGE worst case is closer to the lowest rather than worst.

When looking at these data sets, you need to see the data sources used to populate the model, the assumptions used and also whether they are projections based on certain assumptions or predictions for what will actually happen. The two are not the same. Projections are intended to stimulate action to prevent them happening.

One of the problems at present is that testing data from Test and Trace is a complete mess, so any projection or prediction based on that is unreliable. The prevalence studies conducted by ONS where community rates are estimated by random sampling should be a better estimate of what is really happening. There is no doubt tat hospital admissions are rising fast and in some places ICU beds are at or near capacity. The average citizen doesn't need to know exactly what the R is because they don't know what that means anyway, they just need to know that if they don't get their act together then when they or a family member inevitably needs an NHS bed for Covid or something else, there won't be one available for them.
 

road2ruin

Q-School Graduate
Joined
Jan 3, 2012
Messages
2,332
Location
Surrey
Visit site
In that graphic, the line marked as the SAGE worst case is closer to the lowest rather than worst.

When looking at these data sets, you need to see the data sources used to populate the model, the assumptions used and also whether they are projections based on certain assumptions or predictions for what will actually happen. The two are not the same. Projections are intended to stimulate action to prevent them happening.

One of the problems at present is that testing data from Test and Trace is a complete mess, so any projection or prediction based on that is unreliable. The prevalence studies conducted by ONS where community rates are estimated by random sampling should be a better estimate of what is really happening. There is no doubt tat hospital admissions are rising fast and in some places ICU beds are at or near capacity. The average citizen doesn't need to know exactly what the R is because they don't know what that means anyway, they just need to know that if they don't get their act together then when they or a family member inevitably needs an NHS bed for Covid or something else, there won't be one available for them.

I agree however what I don't understand is that when we're told about cases rising and things getting out of control today how they can stand up there presenting a graph that (apparently) using the data from the Cambridge statistical unit was three weeks out of date. The more recent data from the same unit is less frightening but was not used. Is that because it doesn't fit the narrative of what they are trying to achieve? If they show that, potentially, cases are plateauing etc then people will not take it seriously so they go with the apocalyptic version as it makes a better graph?
 

Ethan

Money List Winner
Joined
Jun 30, 2009
Messages
11,793
Location
Bearwood Lakes, Berks
Visit site
I agree however what I don't understand is that when we're told about cases rising and things getting out of control today how they can stand up there presenting a graph that (apparently) using the data from the Cambridge statistical unit was three weeks out of date. The more recent data from the same unit is less frightening but was not used. Is that because it doesn't fit the narrative of what they are trying to achieve? If they show that, potentially, cases are plateauing etc then people will not take it seriously so they go with the apocalyptic version as it makes a better graph?

I can't answer that. It is always preferable to use more recent and reliable data, but anyway you do it, predicting what is about to happen has a large measure of uncertainty attached, especially when the factors which influence the short term have already taken place and you are in the dead time waiting for that to translate into cases.

But does it really matter? If people are told there are going to be 2000, 5000, 10000 more cases, and 100,200, 500 deaths a day, how does their behaviour change across that scale? Is there a point where they say 'well, 100 deaths a day is acceptable so I can still go to the pub, but gee, 2000 a day is bad. I'll stay at home'?

The public does not have a good feel for what these numbers actually mean. They look at a 1% risk and see a 99% chance that it will be alright, not realising that the 1% repeats. The message needs to be simple, that the NHS will be overwhelmed and the economy, their job, the pubs and shops, will not be opened until people get their act together.
 

SwingsitlikeHogan

Major Champion
Joined
Jul 24, 2012
Messages
32,578
Visit site
Indeed - we are not good on statistics and what they mean. So in it's simplest (I know all will know this) in a group of 10 friends the stats tell us that half will develop a cancer in their lifetimes. If five of the friends develop a cancer that doesn't mean that cancer is done with that group of ten - the probability that any one of the other five developing a cancer in their lifetime remains the same - indeed it is possible that all ten will develop a cancer. I suspect that sort of understanding escapes many of us when looking at the stats for coronavirus.
 

Ethan

Money List Winner
Joined
Jun 30, 2009
Messages
11,793
Location
Bearwood Lakes, Berks
Visit site
Indeed - we are not good on statistics and what they mean. So in it's simplest (I know all will know this) in a group of 10 friends the stats tell us that half will develop a cancer in their lifetimes. If five of the friends develop a cancer that doesn't mean that cancer is done with that group of ten - the probability that any one of the other five developing a cancer in their lifetime remains the same - indeed it is possible that all ten will develop a cancer. I suspect that sort of understanding escapes many of us when looking at the stats for coronavirus.

I remember some years ago when I was in public health, a story was published saying that the oral contraceptive pill doubled the risk of thromboembolic problems. The data was good and the findings reliable. Many women on the pill freaked out, and this being just before mass social media, meetings were organised where worried women came to talk about it.

Thing was, although the risk had indeed been shown to be double, it had only doubled from really very unlikely to very unlikely, and driving to a meeting in an agitated state to hear about it probably exposed the woman to greater risk. I heard one women on TV saying she was so worried she smoked a whole packet of cigarettes. That definitely exposed her to more risk.

People have an unusual relationships with risk, with contradictions between how they respond to familiar vs unfamiliar risks.
 
Top